Understanding pandemic modeling
Disclaimer
Recently, I participated in a hackathon against Covid-19. We were interest in modelling the pandemic, or to be precise, some possible outcomes. Note that the idea here is not to provide an accurent model for the pandemic. It only represents a statisticians first contact with epidemological research and aims to explain it in my own terms. As we used graphs to model the scenario, it was also a place where I could employ some of the more theoretical research. Since the pandemic concernes us all, I tried to use no math in this article.
If you want precise modelling, ask the pros (a.k.a. your fav epidemologist)
Understanding the Pandemic
In its simplest form, we can think of the pandemic as the result from a virus that can be transmitted from human to human. If you get the virus, you can either recover or die from it. In a subset of the period where you are infected but not yet recovered or dead, you can in addition infect other people around you. This is where the (by now) famous \(R\)-value or reproduction value comes in. If you are not the only one infected by the disease, we can take an average of the number of people that are infected from a single person.
If you just think about that for a minute, it becomes clear how difficult it must be to calculate this value. We must first identify all agents who carry the virus at any given moment (which might not be easy given not all cases are symptomatic), then all who were infected by any one agent and finally find an average which by definition will already be outdated at the time of publication.
This in itself is already interesting, and something that people a lot more competent than I spend a lot of time thinkg about, but not the problem we try to visualize here. As this is still the beginning of the pandemic, we would like to remind everyone that his or her behaviour has direct consequences on everyone (there is a reason why this whole hackathon was done online). In the follwoing we will go through the simplest of epidemological models, and being in the nice mathematical framework, we can try to simulate how the pandemic could turn out if everyone acts like you. This also has the advantage of providing global parameters for our models (which means it might be far from reality, but that is not the point of the engine you can find further down in this article).
How to model all of this
We already saw a few things that need to be modelled if we are to understand the pandemic. But lets put that aside for a minute and look at one of the basic epidemological models: The SIR-Model. SIR stands for __S__usceptible, __I__nfectious and __R__ecovered and goes back all the way the 1920’s where Kermack and McKendrick published the general idea in a subsection of their paper.
The SIR-Model is part of the Compartemental Models Family, and it is just that. Agents can be classified into compartements (eg. S,I,R). This might seem rather restrictive, but it can be extendend. For example, for our engine, we consider the following:
- Each agent is either Susceptible, Infectious, Recovered or Dead
- If an agent is Recovered, she has limited immunity from being reinfected (in our simple world, we use a Bernoulli trial)
- If an agent is Infectious, he infects his contacts with a probability \(p\) (again, we can use a Bernoulli trial)
- If an agent is Infected, she can develop complications with probability \(u\), this probability can be dependent on eg. the age of the agent.
- If an agent has developed complications, he can die with probability \(q\) (again, you guessed it, we can model this using a Bernoulli trial). Here we have a small gist though. As the main message from the governments around the world is to stay home “to flatten the curve” the value \(q\) is adaptive. If hospitals are overcrowded, (ie when too many agents are infected and hence too many develop complications) the value for \(q\) rises.
So these are the basics. There are some numbers that need to be estimated (eg. the probability of transmission etc.), we opted to take them from the literature (there are references in the git-repo). Next, we decided to model the population with a clustered graph.
The idea is that we model the whole population (in our case of Switzerland) in the same fashion as a representative agent (ie. the user of our tool). Usually this would be deemed oversimplistic but here we actually want to show what would happen if everyone acted like oneself (hence the engine-name ActLikeMe). Each node in the graph has a random number of edges, but the average degree is decided by the user (eg. the answer to the question “how many contacts do you have”). The nodes are then slightly clustered to simulate eg. family or friendship ties (eg. there are more densly connected subgroups within the graph), but the graph stays connected (there are no insular nodes). A few agents are then infected and the model is run for subsequent periods (see the .gif below) until everyone is either recovered or dead (how grim). Statistics can then be calculated based on what happend in every period.
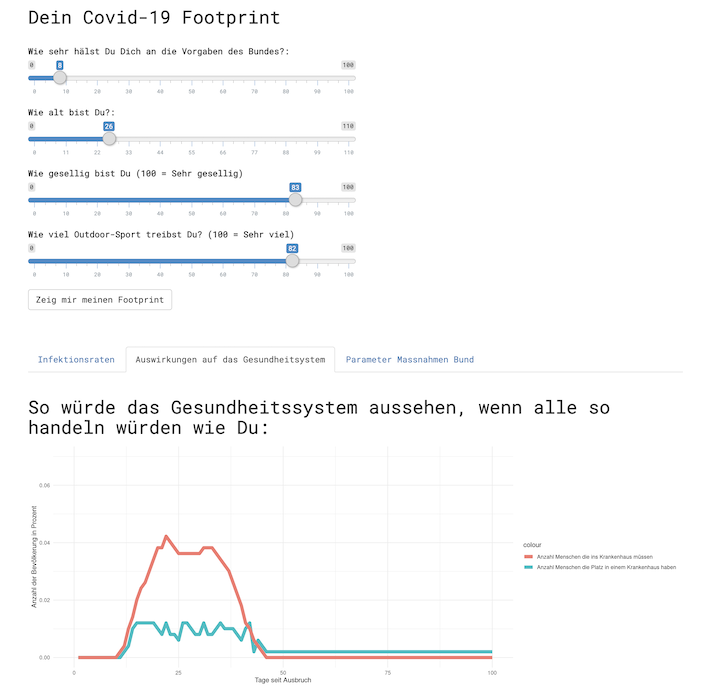
The ActLikeMe Engine
Finally we got the engine to run. A user can enter parameters about her behaviour and the graph is constructed according to those. The SIR model is then run, the data saved and finally displayed over a R-Shiny App. And all that was done in less than 48 hours!
As said, it might not be precise in epidemological terms, but the gist of ones own behaviour should be clear. Its not only a matter of the some to stop the pandemic, its something where everyone needs to participate!
 Agents are green if they are susceptible, red when they are infectious, yellow when infected but not infectuous, grey when recovered and black when dead